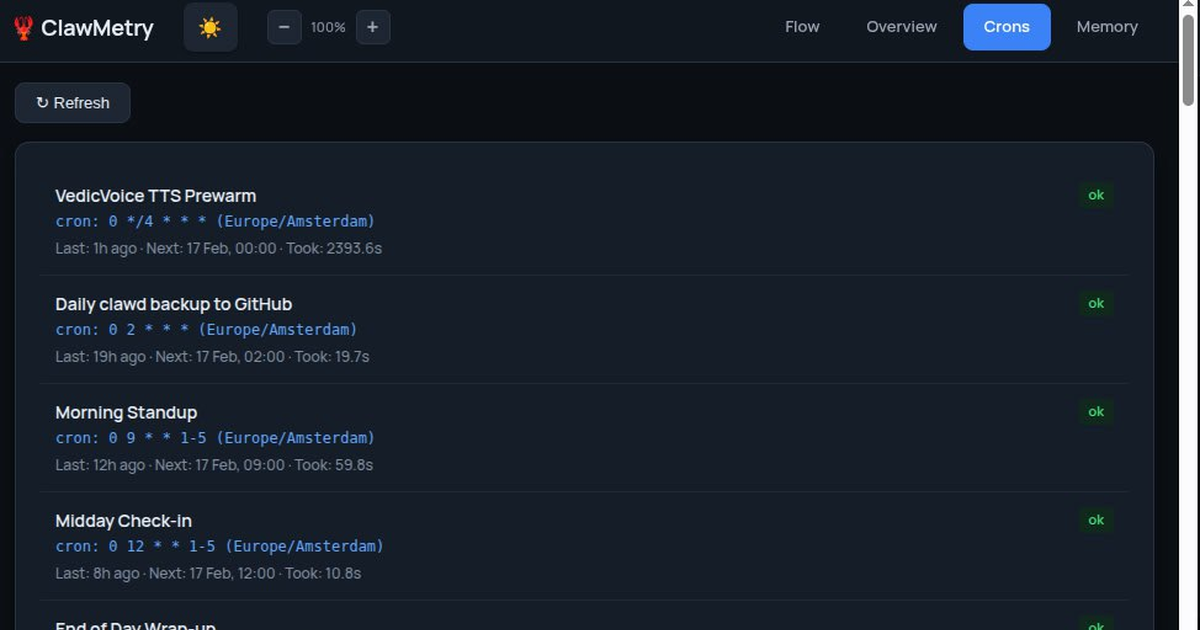
ClawMetry is a free, open-source real-time observability dashboard designed specifically for developers and teams building with OpenClaw AI agents and other supported runtimes. Its primary purpose is to provide immediate, comprehensive visibility into the complex operations of AI agents, which often work autonomously by spawning sub-agents, calling tools, and executing tasks. The dashboard is built for engineers, founders, and operations teams who need to monitor, debug, and control their AI agent fleets to prevent budget overruns and ensure reliable performance. It serves as a mission control center, transforming the opaque inner workings of AI agents into clear, actionable data streams that can be monitored in real time from a single interface, whether on a laptop, server, or dedicated desk device.
Before tools like ClawMetry, developers working with AI agents faced significant challenges with zero visibility into their operations. Agents would spawn sub-agents, burn through tokens, and call various tools without any clear indication of what they were doing or how much they were costing. This lack of transparency meant that runaway loops could spiral costs overnight, and teams would only discover issues when invoices arrived or customers reported problems. Developers were left hoping their agents were working correctly, unable to see if an agent was stuck, which websites it was searching, or where tokens were being consumed. This problem was particularly acute with sub-agents spawning other sub-agents, leading to fast cost escalation and debugging nightmares, as there was no way to tie every token back to the specific task that spent it.
One of the first major feature groups is comprehensive cost tracking and budget protection. ClawMetry meticulously monitors token usage and costs per session, per model, and per tool, providing clear breakdowns before invoices arrive. It flags runaway loops the moment they start, such as detecting 'codex looping, 38 tool calls, no progress,' and can alert users when an agent crosses a predefined budget threshold. This allows users to stop problematic agents with a single tap from their phone, dashboard, or desk device, preventing budget overruns. The system shows the live spawn tree of sub-agents, making it easy to identify which agent or task is responsible for excessive spending, thereby giving teams the control to manage their AI bills effectively without needing to change their underlying models.
The second major feature group centers on real-time operational visibility and debugging. ClawMetry provides a live flow visualization that shows the actual decision path an agent took, step by step. It monitors channels, gateways, models, tools, and nodes, updating this information in real time as events happen. This allows users to diagnose a stuck agent in seconds, seeing exactly where it is in its workflow, what tools it is calling, and whether it is making progress. The dashboard displays cron job status, service uptime, disk usage, and active sub-agents at a glance, ensuring operational health is always visible. Session transcripts and tool call traces are logged, creating a complete audit trail for post-mortem analysis or compliance reviews.
admin
A third critical capability is its deep integration with the OpenClaw ecosystem and support for numerous runtimes. ClawMetry hooks directly into OpenClaw's task system, showing which agents are assigned to which tasks. It supports a wide array of agent runtimes including OpenClaw, NVIDIA NemoClaw, NanoClaw, PicoClaw, Claude Code, Codex, Cursor, Aider, Goose, OpenCode, Qwen, and Hermes. It monitors specific OpenClaw concepts like memory file changes (SOUL.md, MEMORY.md, AGENTS.md) and channel activity. Furthermore, it is OpenTelemetry-native, allowing users to send traces to external systems like Datadog, Grafana, or Honeycomb without vendor lock-in, supporting standard OTLP on /v1/traces and /v1/metrics endpoints.
Technically, ClawMetry is designed for simplicity and privacy. Installation is achieved with a single command like `pip install clawmetry` followed by `clawmetry onboard`, and it auto-detects the OpenClaw workspace with no configuration file required. It runs entirely locally on the user's machine—on Linux, macOS, Windows (via WSL), Raspberry Pi, and other ARM devices—ensuring that sensitive data like session transcripts and Personally Identifiable Information (PII) never leave the user's network. The optional ClawMetry Cloud component uses end-to-end encryption with keys only the user holds, syncing only simple totals like cost and health metrics to power a hosted dashboard while keeping detailed data private.
The benefits for users are both immediate and measurable. Teams gain unprecedented control over AI operational costs, often discovering and eliminating inefficient token usage that can reduce bills significantly. Operational reliability improves as cron failures and stuck agents are identified before customers are affected. Developers save immense debugging time by moving from guesswork to precise, visual understanding of agent workflows. Compliance and audit readiness is enhanced through complete logs of every tool call and agent action. Ultimately, it transforms AI agent development from a hopeful, opaque process into a manageable, observable, and cost-effective engineering practice.
Concrete use cases illustrate its value. A developer can ask OpenClaw to perform a complex task and use ClawMetry to watch in real time as sub-agents spawn, tools are called, and tokens are consumed, intervening if a loop is detected. A startup can monitor their production AI fleet, getting alerted via phone if a cron job fails or an agent's cost exceeds a limit, then stopping it instantly. An operations team can audit exactly what an agent did last Tuesday by reviewing the session timeline, tool calls, and associated costs. A developer integrating with physical devices, like a Phillips Hue spotlight, can use ClawMetry's visualization to understand agent activity that triggers hardware actions.
The target users are primarily developers, engineers, and founders building with OpenClaw and similar AI agent runtimes, including professionals from companies like OpenAI, Google, and PostHog. It also serves compliance and operations teams who need audit trails without data leaving their infrastructure. Integrations are broad, supporting over ten runtimes and exporting to OpenTelemetry-compatible systems. The tech stack is Python-based (3.8+), running across major operating systems and architectures. Pricing is free and open-source (MIT licensed) for local use, with managed deployment, volume pricing, and SLAs available for teams with 10+ node fleets who need enterprise support.
In summary, ClawMetry fills a critical gap in the AI agent ecosystem by providing the observability tooling that builders desperately need. It turns the black box of autonomous AI operations into a transparent, controllable system where costs are understood, failures are caught early, and every action is auditable. By running locally and respecting privacy, it offers powerful insights without compromising security, making it an essential tool for anyone serious about deploying and scaling AI agents in a reliable and cost-effective manner.
ClawMetry is built for developers, engineers, and founders who are building and deploying AI agents using OpenClaw and similar runtimes like NVIDIA NemoClaw, Claude Code, and Codex. It targets professionals at tech companies, startups, and enterprises who need visibility into autonomous agent operations to control costs, ensure reliability, and debug complex behaviors. The tool also serves compliance officers and operations teams who require audit trails of AI agent actions without sending sensitive data outside their infrastructure. Users range from individual developers running agents on laptops to teams managing fleets across cloud servers and edge devices like Raspberry Pi.
Updated 2026-02-28