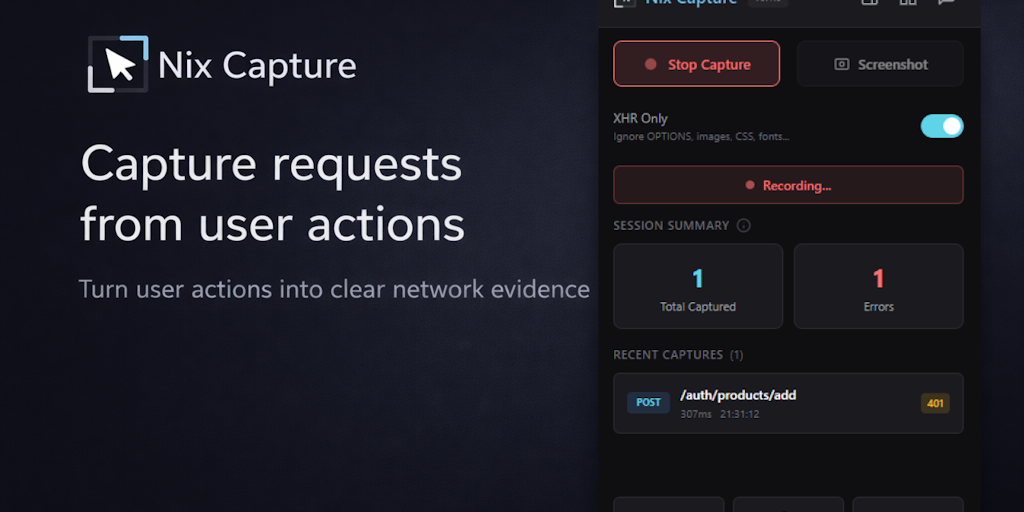
Nix Capture is a Chrome extension that records network requests while reproducing issues and exports everything engineers need for bug reports in seconds. It requires no DevTools access or technical knowledge, making it accessible for QA, support, and product teams.
Nix Capture is a Chrome extension designed to simplify network request recording for bug reports. It belongs to the category of developer tools and debugging utilities, yet its interface is crafted for non-technical users such as QA engineers, support specialists, and product managers. The core value lies in its ability to capture all network activity during issue reproduction without requiring access to browser DevTools or deep technical knowledge. Users can record the exact sequence of API calls, headers, and responses that occur when a bug is encountered, then export that data in formats developers immediately understand. This eliminates the back-and-forth often needed to gather technical context. By focusing on ease of use and accurate data capture, Nix Capture bridges the gap between those who find bugs and those who fix them.
The primary problem Nix Capture solves is the difficulty non-technical team members face when trying to capture network data for debugging. Chrome's DevTools, while comprehensive, presents a steep learning curve for those without engineering backgrounds. Bug reports from support or QA often lack the specific network logs developers need, leading to lengthy clarification cycles and delayed fixes. This inefficiency slows down product development and frustrates everyone involved. Nix Capture removes this barrier by providing a one-click solution that records all relevant network requests while the user reproduces the issue. As a result, bug reports become self-contained with complete technical context, enabling developers to dive straight into problem-solving without missing crucial information.
A key feature of Nix Capture is that it requires no DevTools access or technical expertise. Users simply activate the extension, reproduce the bug or behavior of interest, and the extension automatically captures every network request and response that occurs. This includes XHRs, fetch calls, WebSocket messages, and more. The captured data is presented in a clean, filterable list that non-technical users can review before exporting. This feature is especially useful because it empowers anyone on the team to contribute detailed technical data without training. Instead of relying on developers to guide them through browser inspection tools, support and QA staff can independently generate high-quality logs that speed up the debugging process significantly.
Another major feature is the multiple export formats Nix Capture supports. Users can export captured network requests as cURL commands, JSON objects, or standard HAR files. cURL commands are particularly convenient for developers who want to quickly reproduce API calls in their terminal. JSON exports provide a structured format that can be easily parsed by automated testing scripts or used in custom debugging workflows. HAR files are a universal format supported by many debugging tools and browsers. By offering these three options, Nix Capture ensures that the data can be handed off in whatever form the development team prefers. This flexibility reduces friction and makes the tool adaptable to various workflows.
Publisher
A
admin
Launch Date2026-02-27
Platformweb
Pricingfree
Domain Authority
Ahrefs DR0/100
Traffic Insights
Month2026-01
Estimated Visits0
MoM Visits GrowthN/A(+0)
Avg Time on Site0s